Stretching of a plane, square plate with a hole serves as a frequent computational example for the use of theory of plane state of stress. The computational model prepared as a bitmap image has to be stored in the software directory projects/plate.bmp. Let's move without delay to solve this problem in GRoT>.
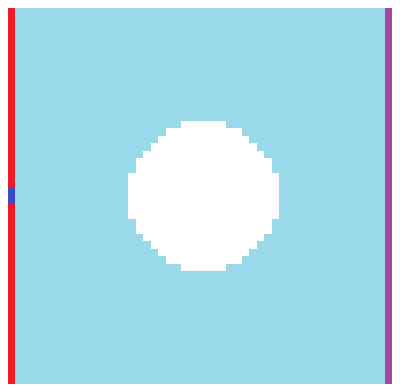
The plate is a steel square sheet with a side length of 200 mm, a hole diameter of 80 mm and a thickness of 4 mm. On one of its sides there is a tensile force of 1000 N applied. The other side is fixed in the tension direction and additionally two middle nodes of this side are fixed in both directions. Set material is steel with a Young modulus of 210 GPa and Poisson ratio 0.3. The computational model prepared in Paint is presented below.
The resulting bitmap should be then stored in the GRoT> directory in the projects folder as plate.bmp.
The most important commands in the input file for the problem of the plate tension are as the following.
Set the type of analysis as a plane state of stress, indicate the geometry file name, assign a material, choose the
unit, scale the model four times (the side in pixels is 50, in fact it is 200 mm) and assign force to the violet color.
This is accomplished by the following commands.
problem planestress
The remaining commands are described fully in the input file, which is available by default in the GRoT> directory.
bmp grot.bmp
mat steel
unit mm
scale 4
load x 1000 y 0 magenta
The calculation is started by calling a Python script run.py. This can be accomplished in the Windows command line,
in the Linux terminal, or other tool known to the user. The following commands apply to the command prompt for Windows cmd.exe.
In this case, the GRoT> folder is located in the specified directory: C:\grot\
cd C:\grot\

python run.py
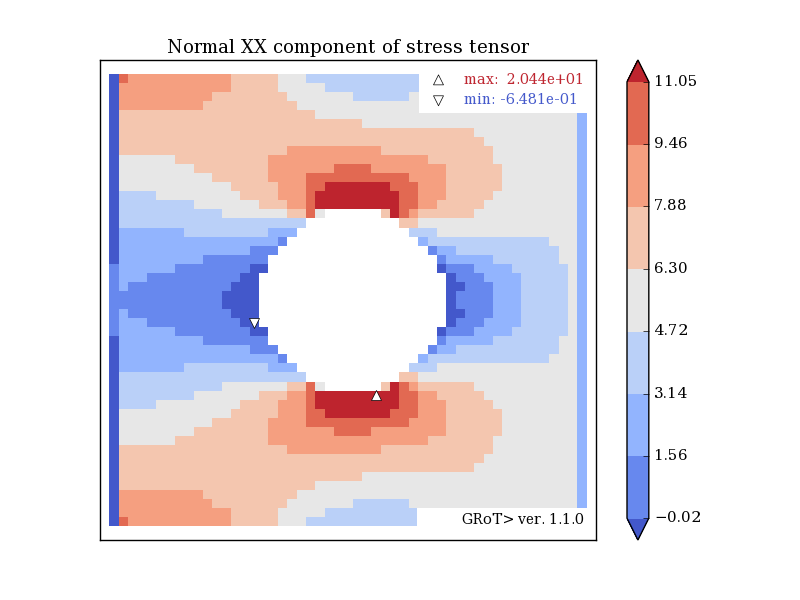
Results files are available in the directory results/plate/. Analytical solution of this problem indicates that the average stress in the plate is 8.3 MPa and the maximum at the edge of the hole is 18,3 MPa. Let's look at the results of the analysis.